1. Quick answer: averaging down can increase the loss you carry
The risks of averaging down in crypto persist after the buying budget runs out. Purchases increase the position and reduce free USDT. The average can fall while market value falls further below cost. More capital then depends on one asset recovering.
Automation cannot supply unlimited money or guarantee buyers and recovery. Investor.gov identifies potential losses, volatility and custody risks in crypto investing. Investor.gov: crypto asset-related investments.
These invented scenarios are educational, not investment advice, historical data, a backtest or a forecast. They assume unleveraged spot trading, constant USDT valuation, no deposits or withdrawals, and no sales during declines unless stated.
2. Why a lower average price does not guarantee profit
Separate acquisition cost in USDT, net coins, current price in USDT per coin and free USDT. Cheaper purchases change cost and quantity without raising the current market price.
AveragePrice = TotalCost / TotalNetQuantity
MarketValue = RemainingQuantity × CurrentPrice
UnrealizedPnL = MarketValue − CostBasisOfRemainingQuantity
UnrealizedROI = UnrealizedPnL / CostBasisOfRemainingQuantity × 100%
These formulas describe remaining holdings; account for realized sales separately. A smaller loss percentage on a larger cost basis can mean a larger USDT loss. Our guide to automated averaging down explains acquisition mechanics; this article examines adverse outcomes.
3. Risks of classic DCA
Classic DCA invests equal amounts at regular intervals regardless of price. It distributes entries over time but can keep buying a deteriorating asset. Discipline does not establish suitability or affordability. Investor.gov: dollar-cost averaging.
Bybit's native DCA documentation specifies investment amount and frequency; its FAQ describes suspension when funds cannot cover the next purchase. These are native Bybit rules. Bybit DCA introduction; DCA FAQ. Compare tools in Spot Grid versus DCA.
4. Risks of price-based averaging down
Price triggers can consume a budget faster than scheduled purchases. Repeated 1% declines compound from successive prices, rather than subtracting equal points from the original.
Model C: initial price 100 USDT, initial purchase 20 USDT, then 20 USDT at every reached 1% decline from the previous actual BUY. The finite version starts with 280 USDT additional free cash: 300 USDT total. Fees are initially zero. Every reached threshold fills exactly, without delay, slippage, order limits or sales. This ideal path is a teaching assumption, not guaranteed TradeMatic behavior.
P(n) = 100 × 0.99^n
N(D) = floor[ln(1 − D) / ln(0.99)]
UnlimitedBuys = 1 + N(D)
FiniteBuys = min[1 + N(D), floor(300 / 20)] = min[1 + N(D), 15]
TotalCost = 20 × BuysForChosenModel
Here 0 ≤ D < 1 is the decline as a fraction, and N counts additional levels already reached, including exact equality. At zero decline N = 0; the logarithmic formula excludes a 100% decline. Floor is necessary: at price 90, level 10 is 90.438208 and has been crossed; level 11 is 89.533825 and has not. Ceiling would identify the next level at or below the endpoint when the ratio is nonintegral, rather than count completed crossings. At an exact level floor and ceiling coincide. A jump from 100 straight to 80 does not mean every intermediate purchase occurred.
5. What happens after a 10% drop?
Model A buys one coin for 100 USDT at price 100, with no additional purchases or fees. At 90 it is worth 90 USDT: a 10 USDT unrealized loss. Returning from 90 to 100 requires 11.111111% price growth.
Model C reaches ten additional thresholds: eleven purchases spend 220 USDT and leave 80. Most cash is already used. Extra coins lower the average, while market value remains below cost.
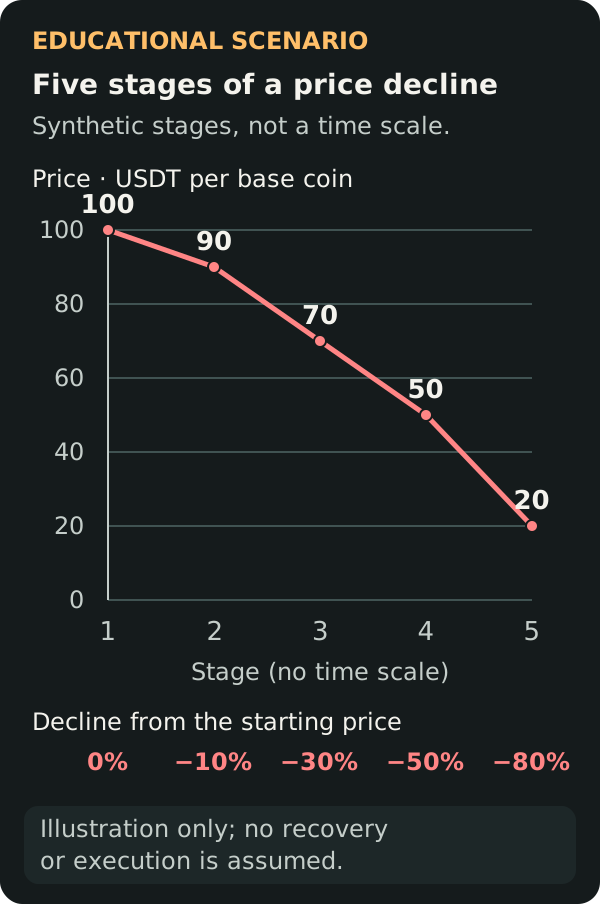
Model A compares four endpoints for one coin:
Scroll horizontally to see every column.
| Drop % | Price USDT/coin | Net coins | Cost USDT | Market value USDT | Unrealized P&L USDT | P&L % | Growth to break-even % |
|---|---|---|---|---|---|---|---|
| 10 | 90 | 1 | 100 | 90 | −10 | −10 | 11.111111 |
| 30 | 70 | 1 | 100 | 70 | −30 | −30 | 42.857143 |
| 50 | 50 | 1 | 100 | 50 | −50 | −50 | 100 |
| 80 | 20 | 1 | 100 | 20 | −80 | −80 | 400 |
6. What happens after a 30% drop?
At price 70, Model A's position is worth 70 USDT and its unrealized loss is 30 USDT. The price must rise 42.857143% to return to 100.
Unlimited Model C crosses 35 additional levels: 36 purchases require 720 USDT. This measures funding demand, not available money. The finite 300 USDT budget funds fifteen purchases; later potential levels are not completed buys.
After cash exhaustion, further price declines revalue the coins without lowering their acquisition average.
7. What happens after a 50% drop?
One coin bought for 100 is now worth 50 USDT. The loss is 50%; recovery to 100 requires a 100% increase because the starting point for that increase is now 50.
Unlimited Model C reaches 68 additional levels and requires 1,380 USDT across 69 buys. Finite Model C retains fifteen purchases: funds ran out earlier. Repeated small orders accumulate substantial spending.
Assess total exposure before adding money. Reliance on repeated unplanned deposits leaves the capital constraint unresolved.
8. What happens after an 80% drop?
At price 20, Model A is worth 20 USDT and shows an 80 USDT unrealized loss. Returning to 100 requires 400% growth: (100 / 20 − 1) × 100%. The larger recovery percentage reflects a smaller starting base; it says nothing about the probability of recovery.
Unlimited Model C would require 160 additional buys, 161 in total, costing 3,220 USDT. The finite version has no free USDT left and retains a deeply impaired holding. A price 80% below its starting point can still fall further.
An old price establishes neither fair value nor a recovery deadline. The SEC's crypto asset securities alert identifies illiquidity and disappearance of a market as risks. Investor.gov crypto risk alert.
9. Compare the four crash scenarios
The first table is finite Model C: 300 USDT total, twenty per buy, successive one-percent levels, no fees or sales. Recovery means growth to the holding's average cost, rather than the original price of 100.
Scroll horizontally to see every column.
| Drop % | Price USDT/coin | Buys | Cost USDT | Free USDT | Net coins | Average USDT/coin | Market value USDT | Unrealized P&L USDT | Growth to break-even % |
|---|---|---|---|---|---|---|---|---|---|
| 10 | 90 | 11 | 220 | 80 | 2.314547 | 95.050993 | 208.30924 | −11.69076 | 5.612214 |
| 30 | 70 | 15 | 300 | 0 | 3.221694 | 93.118722 | 225.518559 | −74.481441 | 33.026746 |
| 50 | 50 | 15 | 300 | 0 | 3.221694 | 93.118722 | 161.084685 | −138.915315 | 86.237444 |
| 80 | 20 | 15 | 300 | 0 | 3.221694 | 93.118722 | 64.433874 | −235.566126 | 365.593611 |
Unlimited Model C separately measures theoretical funding demand. With no finite starting reserve, remaining cash is undefined. Its capital is not available to the finite model.
Scroll horizontally to see every column.
| Drop % | Additional crossed levels | Buys | Required USDT | Net coins | Average USDT/coin | Market value USDT | Unrealized P&L USDT |
|---|---|---|---|---|---|---|---|
| 10 | 10 | 11 | 220 | 2.314547 | 95.050993 | 208.30924 | −11.69076 |
| 30 | 35 | 36 | 720 | 8.631396 | 83.416402 | 604.197722 | −115.802278 |
| 50 | 68 | 69 | 1380 | 19.812911 | 69.65155 | 990.645572 | −389.354428 |
| 80 | 160 | 161 | 3220 | 80.061678 | 40.218992 | 1601.233563 | −1618.766437 |
No starting cash balance is specified for this unlimited-capital comparison. These are theoretical purchases, not executed bot orders.
All displayed results are rounded only for reading; calculations retain precision. A portfolio average is an accounting statistic here, not the price of every individual TradeMatic SELL.
10. The risk of running out of capital
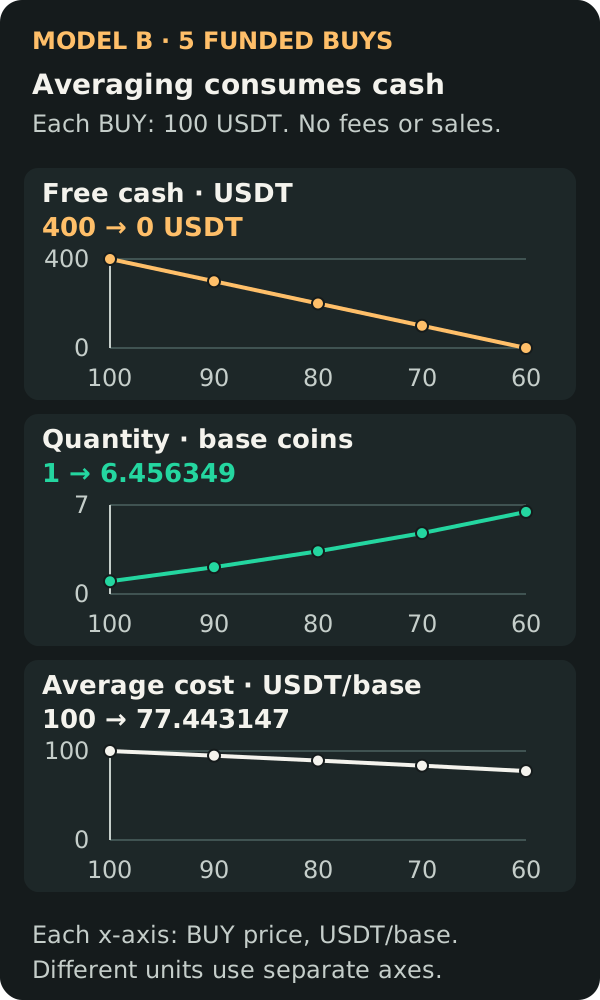
Model B starts with 500 USDT and buys 100 USDT at fixed prices 100, 90, 80, 70 and 60. Lower planned levels 50, 40, 30 and 20 cannot be funded. These are fixed ten-USDT steps, unlike Model C's compounded one-percent steps.
Scroll horizontally to see every column.
| Price USDT/coin | Action | Buy USDT | New coins | Cost USDT | Net coins | Average USDT/coin | Market value USDT | Unrealized P&L USDT | Free USDT |
|---|---|---|---|---|---|---|---|---|---|
| 100 | Bought | 100 | 1 | 100 | 1 | 100 | 100 | 0 | 400 |
| 90 | Bought | 100 | 1.111111 | 200 | 2.111111 | 94.736842 | 190 | −10 | 300 |
| 80 | Bought | 100 | 1.25 | 300 | 3.361111 | 89.256198 | 268.888889 | −31.111111 | 200 |
| 70 | Bought | 100 | 1.428571 | 400 | 4.789683 | 83.512842 | 335.277778 | −64.722222 | 100 |
| 60 | Bought | 100 | 1.666667 | 500 | 6.456349 | 77.443147 | 387.380952 | −112.619048 | 0 |
| 50 | Unfunded: no buy | 0 | 0 | 500 | 6.456349 | 77.443147 | 322.81746 | −177.18254 | 0 |
| 40 | Unfunded: no buy | 0 | 0 | 500 | 6.456349 | 77.443147 | 258.253968 | −241.746032 | 0 |
| 30 | Unfunded: no buy | 0 | 0 | 500 | 6.456349 | 77.443147 | 193.690476 | −306.309524 | 0 |
| 20 | Unfunded: no buy | 0 | 0 | 500 | 6.456349 | 77.443147 | 129.126984 | −370.873016 | 0 |
Model D instead allocates only 300 of a 500 USDT account to twenty-USDT buys; 200 USDT is protected by an external allocation rule. Fifteen purchases, including the first, exhaust the trading allocation at level 14, about 86.874581 USDT. This reserve rule is not a verified built-in TradeMatic feature.
Scroll horizontally to see every column.
| Drop % | Buys | Cost USDT | Free trading USDT | Protected USDT | Market value USDT | Unrealized P&L USDT | Total marked equity USDT |
|---|---|---|---|---|---|---|---|
| 10 | 11 | 220 | 80 | 200 | 208.30924 | −11.69076 | 488.30924 |
| 30 | 15 | 300 | 0 | 200 | 225.518559 | −74.481441 | 425.518559 |
| 50 | 15 | 300 | 0 | 200 | 161.084685 | −138.915315 | 361.084685 |
| 80 | 15 | 300 | 0 | 200 | 64.433874 | −235.566126 | 264.433874 |
Coins committed to SELLs are not free USDT. An above-market sell limit may stay open while new buys become unaffordable. A limit price does not ensure execution. FINRA on market liquidity. See the target-price selling guide for mechanics.
11. The risk of accumulating one coin
More units are not diversification. Reinvesting available cash in one falling coin makes the remaining account increasingly dependent on that asset's outcome. Several coins can also move together, so counting symbols alone does not establish independent exposure. FINRA describes how concentrated and correlated holdings can amplify losses. FINRA: concentration risk.
Track both initial capital committed and current market-value weight: a falling weight can conceal heavy spending. Model D's unused 200 remains outside buying despite trading losses. Its constant USDT valuation excludes stablecoin and custody risks.
12. Realized and unrealized P&L are different
Independent no-fee example: 40 USDT funds two twenty-USDT buys at prices 100 and 80. The first lot, 0.2 coin, sells at 110 for 22 USDT. The remaining 0.25 coin later trades at 20, worth 5 USDT. Realized profit is 2 USDT, unrealized loss 15. Account value is 27 USDT: combined result −13.
Scroll horizontally to see every column.
| Component | Cost USDT | Cash or value USDT | Realized USDT | Unrealized USDT |
|---|---|---|---|---|
| Closed: buy 20 at 100, sell at 110 | 20 | 22 | +2 | 0 |
| Open: buy 20 at 80, now 20 | 20 | 5 | 0 | −15 |
| Combined marked equity | 40 | 27 | +2 | −15 |
Combined economic result: +2 − 15 = −13 USDT. The remaining lot keeps its own 20 USDT cost basis.
Free USDT is 22, remaining cost basis 20, and coin value 5. Do not arbitrarily subtract realized profit from remaining cost basis. A closed losing sale similarly uses its own net proceeds and allocated cost.
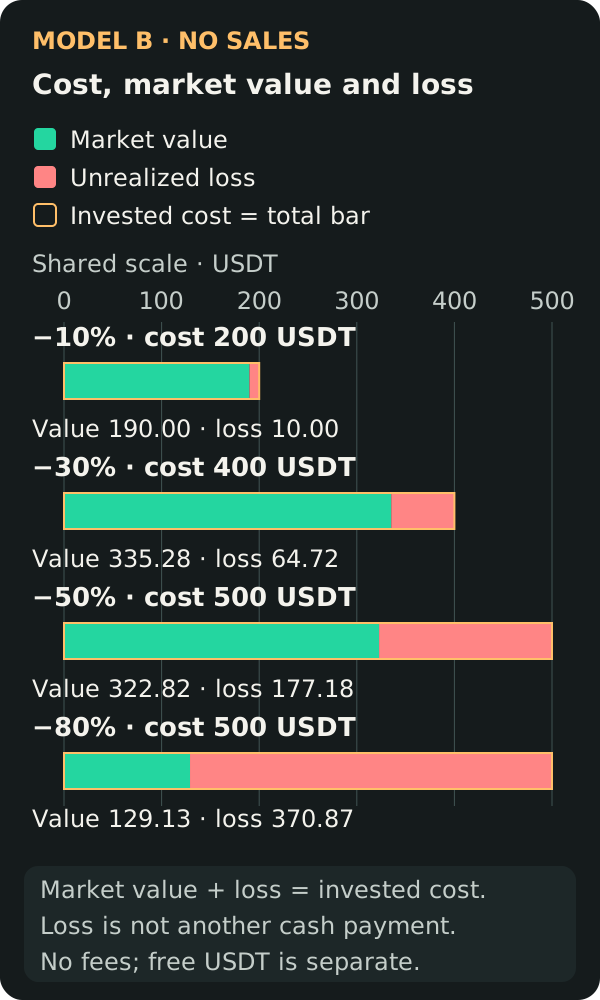
Without external cash flows, account change equals realized P&L plus unrealized P&L when all costs are consistently included. A list of successful SELLs alone cannot establish the total portfolio result.
13. How trading fees change the result
Model E repeats finite Model C with hypothetical 0.1% BUY fees deducted in the base coin and 0.1% SELL fees deducted in USDT. BUY cost stays the same, but fewer coins are received. A sale remains hypothetical until executed.
NetQuantity = GrossQuantity × (1 − BuyFeeRate)
GrossSaleProceeds = NetQuantity × SalePrice
NetSaleProceeds = GrossSaleProceeds × (1 − SellFeeRate)
BreakEven = RemainingCostBasis / [NetQuantity × (1 − SellFeeRate)]
Scroll horizontally to see every column.
| Drop % | Gross coins | BUY fee coins | Net coins | Average USDT/coin | Break-even USDT/coin | Hyp. gross sale USDT | Hyp. SELL fee USDT | Hyp. net sale USDT | Hyp. realized P&L USDT |
|---|---|---|---|---|---|---|---|---|---|
| 50 | 3.221694 | 0.003222 | 3.218472 | 93.211934 | 93.305239 | 160.9236 | 0.160924 | 160.762676 | −139.237324 |
| 80 | 3.221694 | 0.003222 | 3.218472 | 93.211934 | 93.305239 | 64.36944 | 0.064369 | 64.305071 | −235.694929 |
Cost remains 300 USDT. No sale has occurred in the holding scenario: actual realized P&L and actual SELL fee paid are both zero.
The BUY fee already reduces net quantity; subtracting its quote equivalent again double-counts it. The possible SELL fee is an exit estimate, not a paid expense. Formula rates are fractions: 0.1% = 0.001.
Bybit documents fees on executed quantities and asset-dependent fee units; actual rates depend on the account and product. Spot fees explained; fee structure. Try alternative assumptions in the spot fee calculator. A positive gross spread can be smaller than total costs.
14. When the market does not recover
Model F holds finite Model C's exhausted fifteen-purchase position. First the price stays at 20 for an unspecified period; then a separate stress endpoint places it at 10. The model assigns no calendar dates or probability to either path.
Scroll horizontally to see every column.
| Scenario | Cost USDT | Net coins | Price USDT/coin | Market value USDT | Unrealized P&L USDT | Free USDT | Hyp. exit USDT | P&L if sold USDT | Actual realized USDT |
|---|---|---|---|---|---|---|---|---|---|
| Plateau at 20 | 300 | 3.221694 | 20 | 64.433874 | −235.566126 | 0 | 64.433874 | −235.566126 | 0 |
| Further fall to 10 | 300 | 3.221694 | 10 | 32.216937 | −267.783063 | 0 | 32.216937 | −267.783063 | 0 |
At a flat low price, waiting changes neither the nominal acquisition cost nor the no-fee valuation. Further decline increases the unrealized loss while free trading USDT remains zero. A hypothetical full sale converts the mark-to-market loss into a realized loss under the stated execution assumptions.
Fees, spread and market impact can lower exit proceeds. A valuation does not promise full execution at that price. No closed losing trade does not mean no economic loss.
15. Ways to limit specific risks
Choose limits before falling prices encourage extra deposits. Position sizing considers tolerable account loss and exit assumptions, beyond individual order size. CME: position size.
- Set a total strategy allocation, a maximum purchase count and an exposure ceiling. Include the initial buy in the count.
- Keep a separate reserve outside the permitted buying allocation. A written reserve is ineffective if automation can still spend it.
- Test wider purchase spacing and limits on one-coin concentration. Wider spacing reduces trigger frequency along the same ideal path, but leaves price risk.
- Review open orders and define conditions for stopping new entries. Reassess market value and free cash separately.
- Stress-test another 50% fall after cash exhaustion, higher fees and a gap that skips modeled levels. Define what to do if an exit cannot fill.
Understand stop-loss trade-offs before relying on them. A stop can execute below its trigger during a gap; a stop-limit can remain unfilled. Investor.gov explains these stock-order mechanics; exchange-specific crypto availability must be checked separately. Investor.gov: stop orders. None of these measures guarantees freedom from loss, and every price decline need not be a buying opportunity.
16. How these risks appear in TradeMatic
Read-only review confirms that TradeMatic measures the next drop from the last actual BUY execution price. Each purchase has separate linked SELL legs using its own price and net quantity, rather than one portfolio-average sale.
A price observation at or below the threshold arms the configured delay. This does not require a bounce; the dispatch path does not recheck that threshold. The configured USDT buy amount is subject to exchange rules and pre-trade checks, including sufficient available spot buying capacity, current market/account data and room for orders. These checks can block an entry, but they do not reserve a chosen part of the account against future buying.
Partial BUY fills can produce linked SELL legs for newly confirmed net coins. A full fill of the latest current SELL can schedule continuation buying; older SELL fills update accounting. Acceptance or a crossed level is not a confirmed full execution. Bybit permits partial execution or cancellation under price limits. Bybit Spot trading rules.
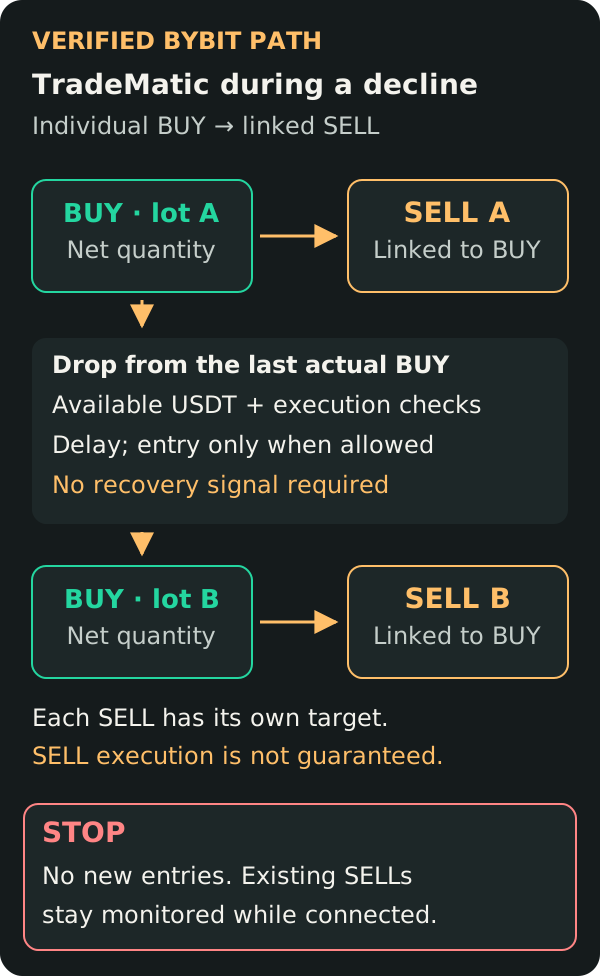
STOP prevents new entries and cancels pending automatic continuation. Submitted or uncertain operations remain subject to reconciliation. Existing owned SELLs continue to be supervised when the runtime and connection are available; STOP does not liquidate coins or cancel every SELL. Review Telegram controls and How It Works before using them.
17. Which risk controls TradeMatic has
This table separates verified operational checks from portfolio limits. Availability does not guarantee execution or protection against a particular loss.
Scroll horizontally to see every column.
| Risk-control mechanism | Status | Explanation and limits |
|---|---|---|
| Configured USDT size per BUY | Available | Per-order sizing only; exchange grid/limits apply. It does not cap total spend. |
| Available spot cash check | Available | New BUY requires confirmed available cash sufficient for its budget; no protected reserve is deducted. |
| Configured entry delay | Available | Timing is constrained by delay and operation state; no fixed maximum averaging-buy count. |
| Unknown-operation and evidence holds | Available | Unresolved operations can pause new entries until reconciliation; this does not limit market drawdown. |
| Open spot-order capacity check | Available | Technical room for an entry and linked exit; not an averaging-buy or exposure limit. |
| Separate linked SELLs and quantity reservations | Available | Exits use confirmed owned net quantity and exchange rules. A SELL may stay unfilled or leave dust. |
| User STOP for new entries | Available | Stops new entries/pending continuation; submitted orders still need reconciliation. Does not liquidate holdings. |
| Non-leveraged spot order requests | Available | Applies to verified TradeMatic requests, not all activity or debt in the exchange account. |
| Automatic stop triggered by a market crash | Not available | Not found in the verified Bybit path; a price decline can qualify another BUY if other checks pass. |
| Global portfolio Stop Loss | Not available | Not found in the verified path. Existing target SELLs are not a portfolio loss limit. |
| Maximum number of averaging purchases | Not available | No configurable averaging-buy count limit found; order capacity is a separate operational check. |
| Total exposure or cumulative spending cap | Not available | Not found in the verified path; funds checks and per-order size do not provide it. |
| Protected USDT cash reserve | Not available | Not found in the verified path. The article’s protected reserve is an external model assumption. |
| Exit after a maximum holding period | Not available | Not found in the verified path; the entry timer is not an exit deadline. |
| Volatility-adaptive buying limit | Not available | Not found in the verified path; fixed drop threshold and delay do not adapt to volatility. |
| Integrated full-wallet unrealized PnL/risk view | Not verified | Current report composition covers bot-owned sales. A helper alone does not verify a live full-wallet risk view. |
| Separate exchange or manual account controls | Not verified | Other exchange features, manual settings, balances, and account-wide borrowing were not inspected. |
“Not available” means not found in the verified TradeMatic path. “Not verified” describes account-wide or integrated behavior not established by source inspection.
The open-order capacity check and configured delay are execution constraints. They are not a lifetime buy-count ceiling, a capital allocation rule or a maximum drawdown rule. The 200 USDT reserve in Model D must therefore be treated as an external capital-management assumption.
18. What averaging down does not guarantee
Averaging down does not guarantee profit, prevent further price declines, create liquidity, ensure a SELL fills, restore the original price or make the budget last throughout a bear market. It does not replace risk limits or remove trading fees. An automated rule can continue to be technically valid while its economic exposure becomes unacceptable to its owner.
19. Assess the whole position before automating
Averaging down changes exposure through purchases; its outcome depends on prices, capital, quantity and costs. Automation repeats the rule. The owner must choose affordable exposure and when buying should end.
Read market value, open losses, free USDT and realized sales together. For broader limitations, see the Risk Disclosure. A lower average deserves attention only alongside the money spent to obtain it.
Frequently asked questions
Is averaging down dangerous during a crypto crash?
It can increase the amount exposed while reducing free cash. If prices keep falling, a lower average can coexist with a larger loss in USDT.
What happens if crypto drops 50%?
A one-coin holding bought at 100 is worth 50 before fees. Its loss is 50%, and price must double to return to 100. Averaging changes the holding and cost basis.
How much does crypto need to recover after an 80% drop?
Price must rise 400% to regain its original level. This is percentage arithmetic, not evidence that the recovery will occur.
Can averaging down reduce losses?
It can reduce average acquisition price and the percentage recovery needed for that holding to break even. Additional spending can also increase the absolute loss if prices fall further.
What happens when I run out of USDT?
Further buys cannot be funded from that exhausted allocation. Coins and unfilled SELLs remain exposed; their market value is not free USDT.
Is DCA safer than buying every price dip?
A schedule and a price trigger spend money differently. Safety depends on the asset, allocation and rules; neither guarantees recovery or preserves capital.
Can a crypto bot guarantee recovery?
No. Automation does not control future prices, liquidity, exchange availability or the money available for continued buying.
How do I calculate unrealized losses?
Multiply remaining net coins by current price, then subtract their remaining cost basis. Keep realized sales separate and state whether hypothetical exit fees are included.
Does TradeMatic automatically stop buying in a crash?
No automatic market-crash stop was found in the reviewed path. Operational checks can block entries; STOP prevents new entries. These do not provide a built-in drawdown or total-exposure cap.
What happens to open sell orders during a prolonged market decline?
They may remain unfilled above market. TradeMatic continues supervising owned SELLs after STOP, but it does not guarantee their execution or automatically liquidate the holding.
Official sources and model scope
Sources and current product behavior checked 19 November 2026. Figures are synthetic teaching scenarios independently verified with precise arithmetic. General securities education below supports economic concepts; it does not classify every crypto asset legally.